

Redefining
PATTERN
Highlights
Clear Charts
Marking the pattern.Price Action
Movement of priceover time.
Time Frame
Exploring Daily,Weekly and Monthly.
Access Anywhere
Mobileand Desktop

NewsLetter

Join our small community of 1000+ subscribers and read our 5 min Newsletter that have the potential to elevate your trading strategy.
Subscribe now to receive these handpicked charts directly in your inbox, and let's navigate the markets together, one chart at a time.
Did you see the charts on our Twitter page?
You liked them ? Cool ! Let's move a level up.
Once we have identified the pattern, now it's time to do systematic analysis on the same.
Now, what does this analysis mean.
Price action, is the movement of a security's price over time, which forms the basis for a securities price chart and makes technical analysis possible.
This movement of price forms "Support" and "Resistance".
These support and resistance level is formed when price reverses and changes direction, leaving behind a peak or trough in the market.
The pattern which we have found must be saying something? What does the pattern say in different conditions?
What the candlesticks, forming on the edge of patterns,
are saying ?
What the Volume bars are saying ?
Combining all these factors, a good entry and exit can be properly planned.
Each analysis is crafted with precision, providing you with a direct and focused approach to market trends.
Subscribe now to receive these handpicked charts directly in your inbox, and let's navigate the markets together, one chart at a time.
Opt for our Complementary Newsletter, in which we share detailed analysis, without any cost.
.png)
Choose
Your Move
This is the chart of REPCO HOME FIN LTD.
This comes under Finance/Rental/Leasin sector.
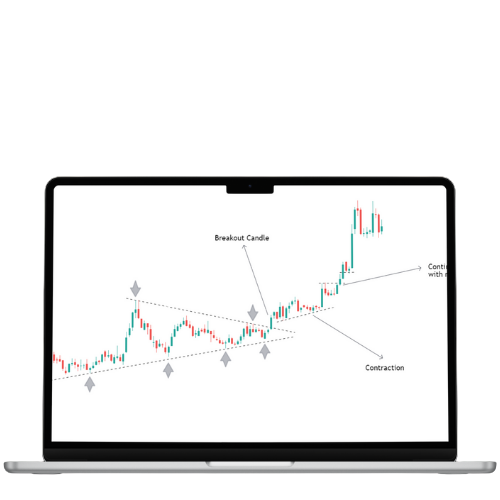
Look at the pattern it made, it's an ascending triangular pattern.
Now, you must be thinking .. why did we put this failed setup in the first place ?
It is to show you and remind you that not every trade you take, will go your way.
This Pattern formation tells us the importance of trade rules .. which we all must follow.
We shared this chart with our audience on 16th Oct 2023, and luckily, on the very next day it gave a breakout.
Let's do an paper trade analysis on this for understanding purpose.
The breakout candle looks very promising ...
The expected entry should have been on this very breakout candle, but hold on ! .. not with all the capital. Suppose we have X Rs for this script, we would enter on the breakout day with 25% of the allocated capital (X).
Now, when the next candle forms, it unviel the momentum.
As we can see, as soon as it gave breakout, the next day price retraced. This retracement of price is another oppurtunity to enter. So, let's enter with another 25 % of the same.
Now, what's the first thing we decide when we write our trade setup rule ? it's STOP LOSS.
When, on second red candle we bought some quantity ..
the nex day ..
OUR STOP LOSS HITS !
But, what was our stop loss ? .. Like every other decision, it's upto the person. But we believe, it should be below the lower trend line of the pattern.
And you can see, on the third day, it broke the trend line during the session, though closed above it.
So, here we exit our trade. Cheers !
The lesson is .. First, we should learn to protect our capital.
LINDE INDIA
Week Interval
This is the chart of LINDE INDIA LTD.
This comes under Processing industries/ Chemical.
Look at the beautiful pattern it has made.
It's Triangular pattern as you can see .. with 4 supports on the lower trend line.
If you have come after watching REPCO .. you must be feeling very amazed, we know that.
This pattern has given around 70% returns in just a matter of 7 to 8 months.
We shared this chart with our community on 16 Jan 2023 .. and on 13 Feb 2023 it started giving breakout. After almost a month.
If we do paper trade analysis on this pattern.
We would first define our STOPLOSS, which would be somewhere near the lower trendline zone.
Now, coming to the position, if we suppose, total amount of X allocated to this script.
We will put 25% of that amount on the very breakout candle itself.
When the price retrace in the next three/four weeks .. that's the time to put another 25% of the capital.
After this, you can see the script made a 15% move from the initial position.
Now if you look at the chart closly .. there is another triangle pattern forming during the consolidation phase. This is a very potential area to keep an eye on.
We have also marked the lower trend line of the triangle, have a look.
At this point of time, we believe, we should ride the rally with our whole allocated amount (X).
as the rally continues .. we keep rising with it.
Now, during first week of Aug, 2023, this script again showed a little correction in the price.
Now, question arises, should we increase our allocation in this phase.
The answer, as usual depends on many conditions .. but broadly speaking, NO.
Because, til now the script has given around 40% move .. and there is a high chance of correction continuation.
So, what do we do here ?
We do partial booking of our profits here. Yes, neither fully booking out of fear .. nor, completely riding out of greed.
At this point of time we should book 75% of out holding of this script.
So, this is another pattern in our books .. where we enjoy the rally ! Cheers !
and yes, those people who booked only 75% at that point of time, they may have rode the rally till the end.
This has been a good trade and a learning of how to ride a rally.
TATA MOTORS
Week Interval
This is one of the well known script .. TATA MOTORS LTD.
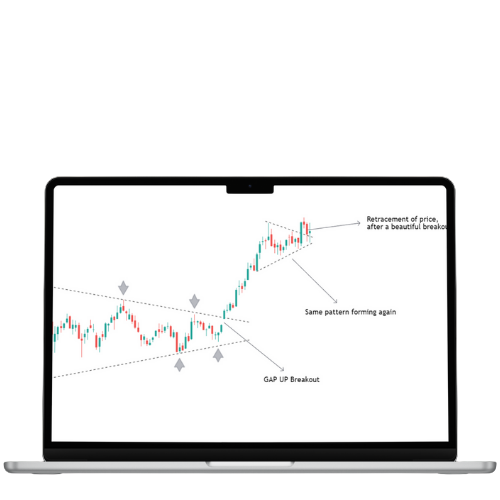
The pattern we are seeing here is triangle pattern.
In this pattern we have three supports on the lower trend line and three resistances on the upper trend line.
We shared this pattern on 06 Mar 2023 and after almost a month, on 10 Apr 2023 .. it gave a beautiful breakout.
Let's quickly start the paper trader analysis of this script!
The breakout candle is formed based on GAP UP opening ..
every individual has his/her own style and rules, we believe that we should take entry in this breakout candle with 25 % of allocated capital for this script.
So, if the allocated capital is X .. we should enter here with 25 % of X.
Now, if you closly look at this rally, you will find after every big green candle there is a little correction candle.
But this is just one candle, which means just a week of correction.
So, the plan is simple ..
During every correction week, we enter the rally with 25 % more.
For example, on 22 May, it formed a red candle .. so we should enter more capital on that phase.
Now, if we keep doing this, we can catch a 30 % move in just matter of couple of months.
This is not good .. this is too good !
Now, as you know, not being greedy we should start partially booking out position.
And when we do this .. we book 75 % of capital deployed and we are left with 25 %.
With this amount we will ride the rest of the rally, if there is .. because if can see huge correction also, nobody can predict the markets!
As we have booked our partial profits, we have no fear of losing the profitability and also we might have chance to ride more.
and when we go further in dates we see, TATA MOTORS again forming a triangle pattern.
It gave breakout on 9th Oct candle and after that 2 red candles, which are showing price retracement.
As of date, when we are sharing this chart with you, the price is retraced to more than 50% of breakout candle .. it can be a good start or a false breakout.
Let's see what happen. But, we should do something to protect our capital.
So, we will mark stoploss, which would be below the lower trend line of the triangle.
This has been another good trade, just like LINDE INDIA. If you have not opened the card of it, you should see the move right now .. a beautiful rally.
Anyways, stay tuned .. let's meet with the next Pattern !!
SURYA ROSHNI
Week Interval
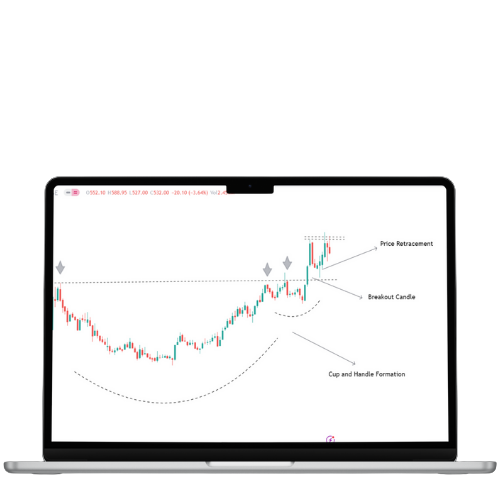
This is the chart of SURYA ROSHNI LTD.
This script has made a beautiful Cup and Handle pattern.
You see that upper horizontal line ? that's called a resistance zone and this script has faced it three times.
We shared this pattern on 30 Aug 2023.
This is when the breakout candle started forming out.
If we start analysing the pattern, we will start with breakout candle.
The breakout candle looks very promising ...
and the follow up candle is the rally we see.
If we count from the breakout candle, it's almost a 30 % move in two weeks.
However, some individuals, according to their strategy prefers to enter the trade before the breakout.
If we count from that phase .. it's almost 40 % move we are seeing.
Coming to next part of the rally, we see a good correction of price in next weeks.
This is the part of the rally .. and it's generally seen as a second oppurtunity to participate in the rally.
and as we can see, after this correction .. coming weeks has shown a good up move of 16 %.
This was a little story regarding this script .. hope you saw this pattern and participated in this rally.
Happy Jorney !!
GABRIEL INDIA
Long Interval
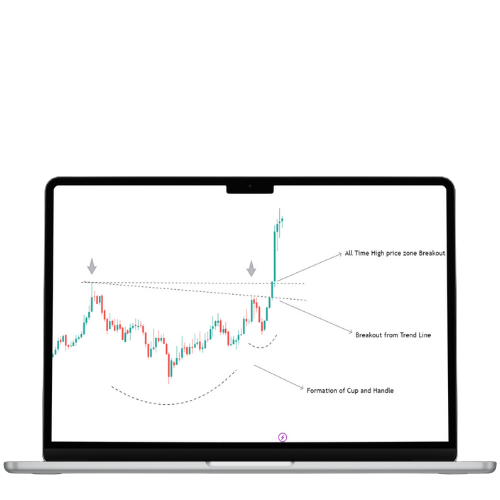
This is the chart of GABRIEL INDIA LTD.
This comes under Producer Manufacturing : Auto Parts.
You must be familiar with this pattern .. it's Cup and Handle pattern!
Let us ask you once, were you able to identify it ?
If you did, Congratulations ! and
if you didn't .. no worries, We keep sharing such patterns for you.
We shared this pattern on 06 june 2023.
Now if we start paper trade analysis on this,
You will see there are two upper trend lines we made. These trend lines shows the upper resistance zones which it might face.
The first tilted line when broken, it's a sign of huge upside move.
and this can be confirmed with the green breakout candle .. it's a proper green candlw with no wicks.
If we kepp track of the rally from it's beginning, it will turn out to be a 40% move already before the breakout.
So, after giving a breakout, it should have corrected a bit and prepared for it's further rally.
But it didn't .. it kept on rising.
Now, one disclamer, do not build high hopes seeing this rally.
150 % in just a matter of 6 months is not a regular thing in market, how a script will perform depends on many market conditions.
But, needless to say, it was a wonderfull rally.
Cheers to those who rode it !
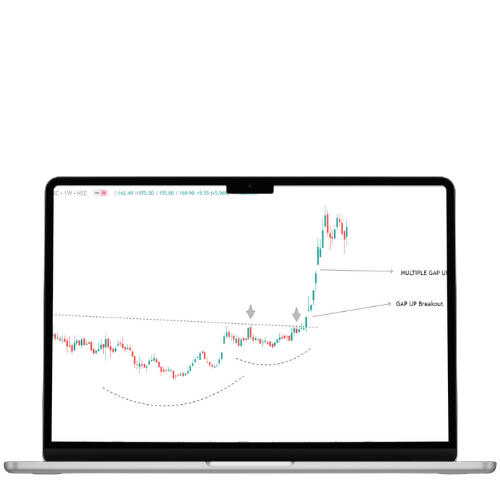
INDRA MEDCO
Week Interval
Hey ! This is another pattern from our book.
This is the chart of INDRA MEDCO.
This comes under Health service sector.
This is called Cup and Handle pattern. This script took 12 months to form this beautiful pattern.
We shared this script on 30 May 2023, and it gave breakout during first week of July 2023.
If you look closing at the pattern, the breakout candle looks so promising.
This script faced resistance three times on upper trend line and gave this beautiful breakout.
There is a one thig to notice .. look at the 10th July candle.
That huge wick brings in a second thought of correction.
After this candle .. we can expect a correction but coming weeks were planning something else for us.
After this, there is series of GAP UP candles, which accounts for almost 40 % of rally.
Cheers to those, who took benefit of this Pattern !!